Data Viz: Improve The Decision-Making Process With Proper Data Visualization
Through interactive visual analytics, data viz improves decisions and eliminates the guesswork.
How much does a wrong decision cost in business?
A considerable part of business decisions are not made by data experts, after all, decision-makers (ultimately, all of us) do not necessarily need to master BI or Data Science fields.
Recently research indicates that companies often believe they are ‘data-driven’ when, in fact, they are not — which means that most people within them are not prepared to analyze data to make decisions.
Using visual analytics standards, such as interactive charts and dashboards, data visualization comes into play to empower better decisions, spread data literacy within companies and, at the end of the day, protect your profit margin.
Read on, learn about data viz and its benefits, and get rid of guesswork in decision making.
What is Data Viz — and what is it for?
Data visualization is the illustrated representation of information. It is imagery dedicated exclusively to messaging or presenting data. The science behind data viz comes from a knowledge of how information is processed.
The main goal of data visualization is to use elements such as charts, graphs, maps, and data tools in an accessible way to see and understand trends, and patterns.
Data viz is one of the steps of the Data Science process. It falls into place after data has been collected, processed, and modeled, and comes into play when data is visualized for conclusions to be made.
How does Data Visualization work?
If you’ve ever stared at a massive spreadsheet, you know much effort it can be to find the patterns. Effective visualization can be a lifesaver with this, helping find the key points, highlighting them, and providing enhanced knowledge through the information.
Data visualization delivers quickly and effectively to communicate information universally.
Research shows that companies often believe they are ‘data-driven’ when, in fact, they are not — which means that most people are not prepared to make decisions based on data.
The practice helps businesses to recognize which factors affect customer behavior; pinpoints areas that need improvement or more attention; makes data more memorable for stakeholders; understands when and where to place specific products; and predicts sales.
What are the benefits of Data Vizualization?
Other benefits of data viz include:
• Improved capacity to absorb information quickly, which enhances insights and faster decision making.
• Increased understanding of next steps to be taken for organizational improvement.
• Enhanced ability to maintain audience’s interest.
• Easier distribution of information.
• Escalates ability to act on findings quickly, achieving success more rapidly with fewer mistakes.
• Helps in identifying patterns
• Favors comparisons
• Enables broader participation in the elaboration of insights
• Facilitates decision making
• It favors the discovery of correlations.
Why does Data Viz is so effective?
In the world of big data, data visualization tools and technologies are essential for analyzing vast amounts of information and making data-driven decisions.
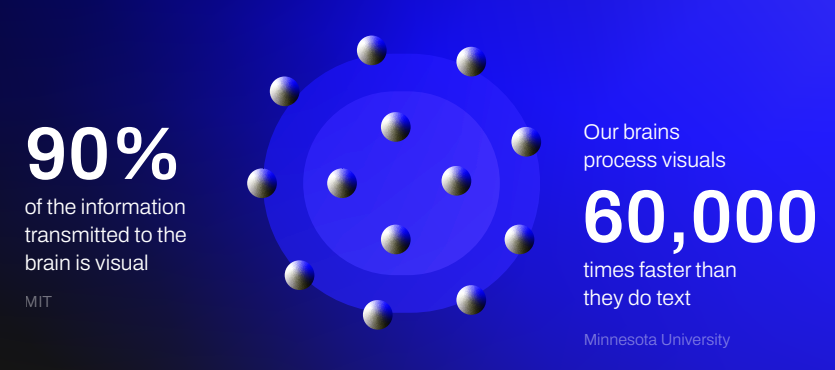
Our eyes are drawn to visuals, which make things more palatable and accessible. According to MIT, 90%. of the information transmitted to the brain is visual. Another research, from Minnesota University, says that our brains process visuals 60,000 times faster than they do text.
But, instead of telling you, let us show you the difference.
Data Viz as a tool for Data Literacy in decision-making processes
In Approaches for Building a Big Data Literacy, a publication from the MIT Media Lab, experts say we can define data literacy as “the ability to transform data into information”.
According to them, the ability is made up of four skills: read, work, analyze, and argument. In few words:
• Read – understanding what data is and what aspects of the world it represents.
• Work – create, acquire, cleanse and manage data.
• Analyze – perform analytical tasks, such as classify, sort, and compare data.
• Argument – using data to support a narrative or communicate a message.
Companies are increasingly using machine learning to try to achieve competitive advantage. But, as you saw in this text, not everyone is prepared to use data to support their decisions.
In the decision-making process, it’s even simple. We are not talking about Big Data, predictive analytics, or something complex. It’s about being able to use data to your own advantage on a day-to-day basis.
Data Visualization — as well as designers and tools like Power BI and Tableau — plays a crucial role in Data Literacy, empowering people to identify good and bad sources of data, how to collect it, comprehend different aspects of data, compare it, and use it to support a narrative.
Investing in Data Visualization reduces uncertainties
So at the end of the day, how impactful can data visualization be for your business? How to generate value with your business data?
Well, there is undoubtedly a great amount of value to be taken from data. But, how can we see the insights hidden within, especially when it comes from varied sources? The takeaway is this: Data is essential, but only if it tells a story. This is precisely where the value of data viz shines.
The role of visualization is to sift the information to present the essentials – after all, a lot of data is unnecessary. Data Science “tidies the house” and, along with visualization, makes it possible to interpret information and make projections, facilitating decision making.
Data analysis promotes efficiency in decision making, reduces errors, improves time to market, but above all else, enables employees to make the best decisions.
Is data easily accessible in your company?
If you’d like assistance on how best to utilize the art of data visualization or would just like to run through a few uncertainties you have with one of our team. Why not take advantage of MJV’s resources, reach out to one of our consultants to see how we can help.
Remember, you don’t have to go it alone.